Sentrics and Predictive Maintenance
Why Predictive?
Warehouse and facilities staff have to do more with less. With leased or shared space you may not be in control of the refrigeration system, the power reliability, etc.. Complex and faulty cooling systems might require an additional safeguard. Sentrics is in a unique position to give you quick, cost effective monitoring. Moving to a predictive posture gives you the ability to respond quicker before problems get out of control.
The cost of using the “run til it fails” mentality is discussed in past articles like this one. To avoid these, the first step is to obtain better monitoring that can spot a problem before damage occurs. Once it’s monitored, the next step is to move from a reactive to a proactive stance to safeguard your facility. Sentrics makes this step easy.
Predictive Maintenance, “AI” and Machine Learning have generated many questions. Sentrics was built with predictive modeling in mind. Similar to the local weather forecast, they’re not right 100% of the time. But they give you the option to play the odds. Similar to grabbing the umbrella when rain is forecast, you can look ahead into what is happening within your facility. I chose a real-world cold storage environment to explain these concepts.
Steps
The charts below help illustrate these points. You’ll find the complete story, along with my take on strengths and weaknesses. The steps are as follows:
- Obtain reliable sensor readings: This is the foundational component to build upon. In order to fulfill proactive monitoring you need robust hardware for these harsh environments. We have used Monnit sensors and chosen a 15 minute update interval to watch temperature in a refrigerated warehouse. Data is stored in the Sentrics database and downloaded using the reports feature.
- Identify trends and repetitive behavior: This is where I hear misleading statements. A significant amount of data is required to unearth the patterns. We used 6 months worth of data, or about 17,000 points, of temperature readings. These readings need to show a high amount of “good” patterns, along with several instances of “bad” patterns. Without this level of information, it is impossible to know if a predictive model will work for you.
- Train the model: We used an IBM tools to sanitize and refine the data. To begin the process, use customized charts to spot the trends. Then we apply skills and patience to try various models or factors to augment the raw data. In our case, the winning model uses percent increase(or decrease), last temp and timestamp. The model with the best results used an algorithm of “GradientBoostingClassifierEstimator” to generate the prediction and probability.
- Deploy the model: With Sentrics, you tie in this “engine” to a virtual sensor that is treated like any other sensor. This is used for visualization or for monitoring. The data from the sensors being monitored gets pushed in every 5 minutes based on current readings. Alarms will be sent when the sensor is predicted to climb above 7.2 degrees.
- Monitor for an Early Warning: The point is to send an early warning signal before something bad happens. Since the model shows a 1 for prediction detected, we can easily setup a monitor for prediction > 0 and send an alert via email or text. The alert will be sent to the people who are best positioned to correct the problem.
Conclusion
Predictive and preventative steps like the example above can help staff respond faster. In order to achieve this, a large swath of historical data must be gathered. After finding the right model we can plug them into the Sentrics alerts. False triggers do occur and in this model we observed about 10% of the time over 1 month period. Equipped with early warnings, operations staff get a 5 to 24 minute head start to take corrective actions. This in turn gives them the breathing room to keep the operations running smoothly.
We’d love to discuss further and help you evaluate your predictive maintenance goals. Call us or email us at info@sentrics.io.
Appendix
Diagram 1: Actual temperature and prediction plotted over time. A reading of 1 in dark blue indicates a predicted failure.
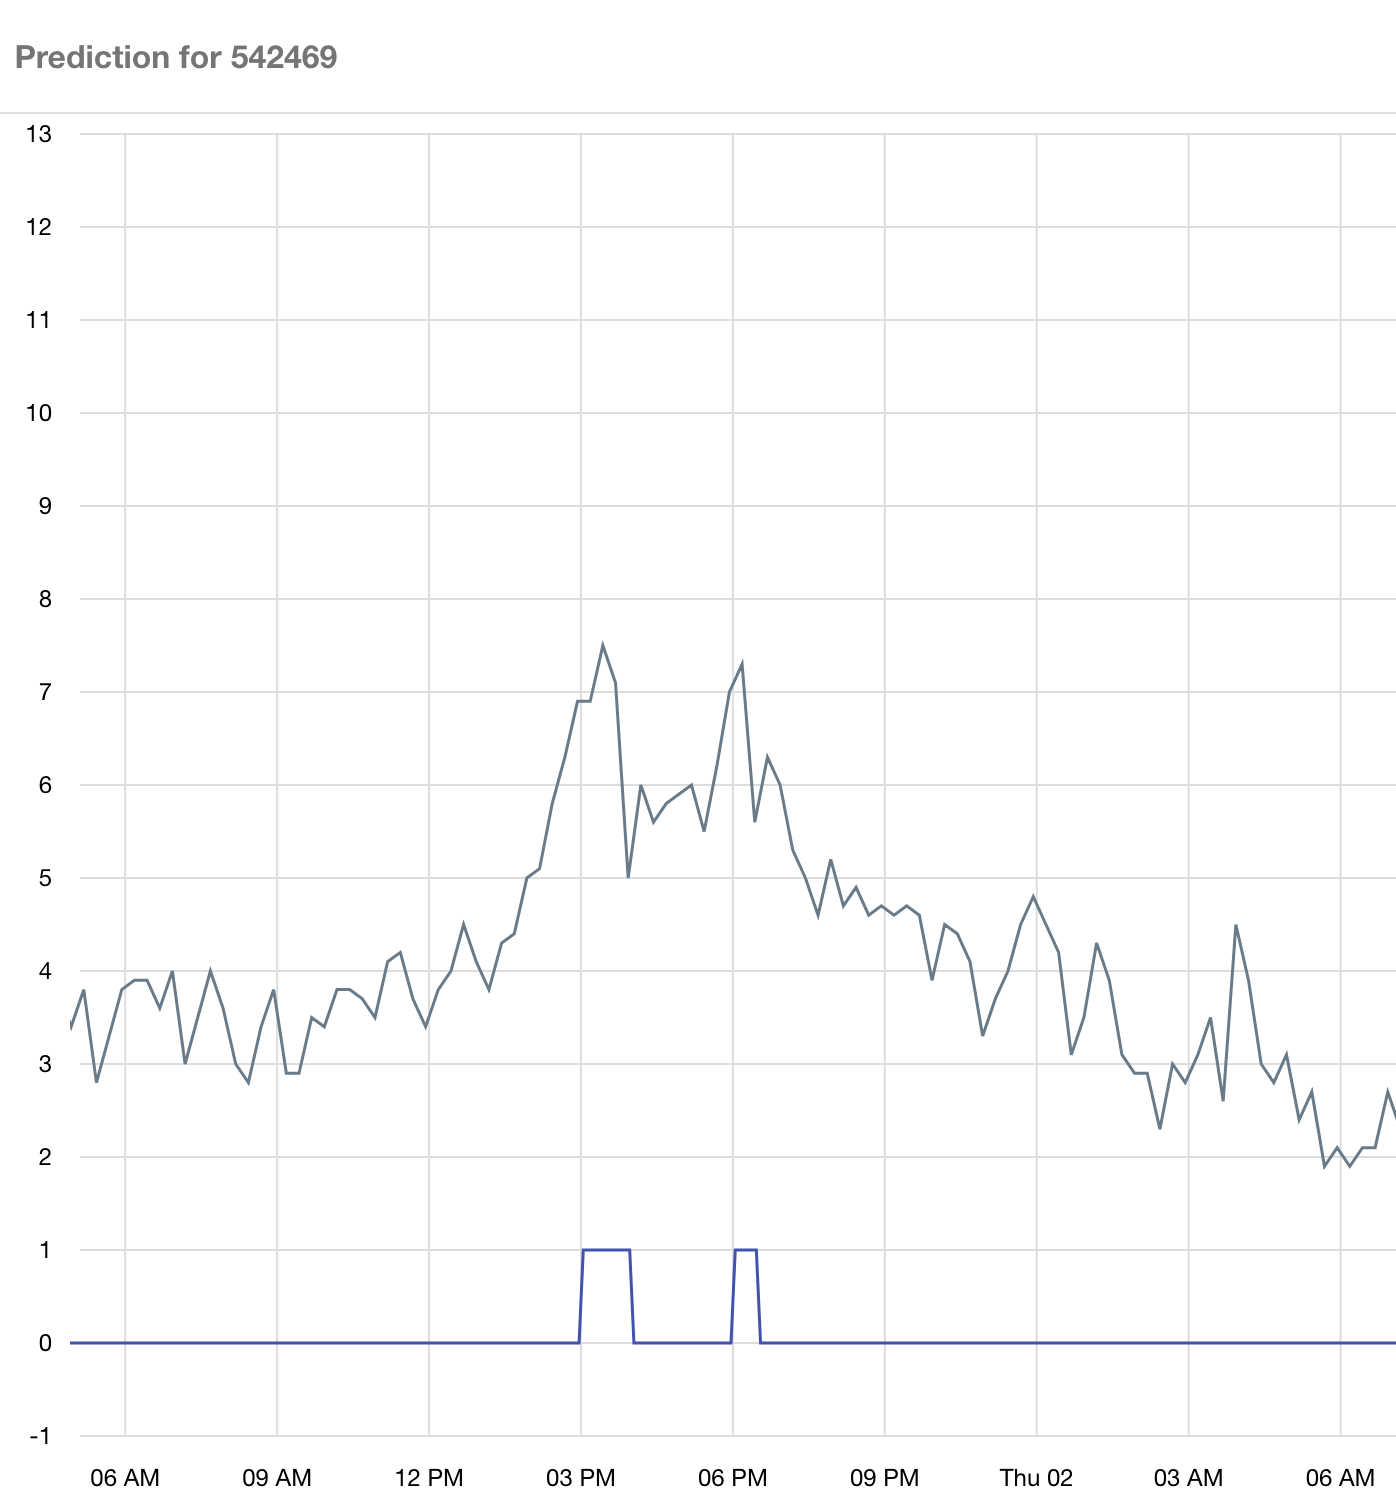
Diagram 2: The time the reading breached 7.5 was 3:25:55 pm for the sensor, above the 7.2 max.
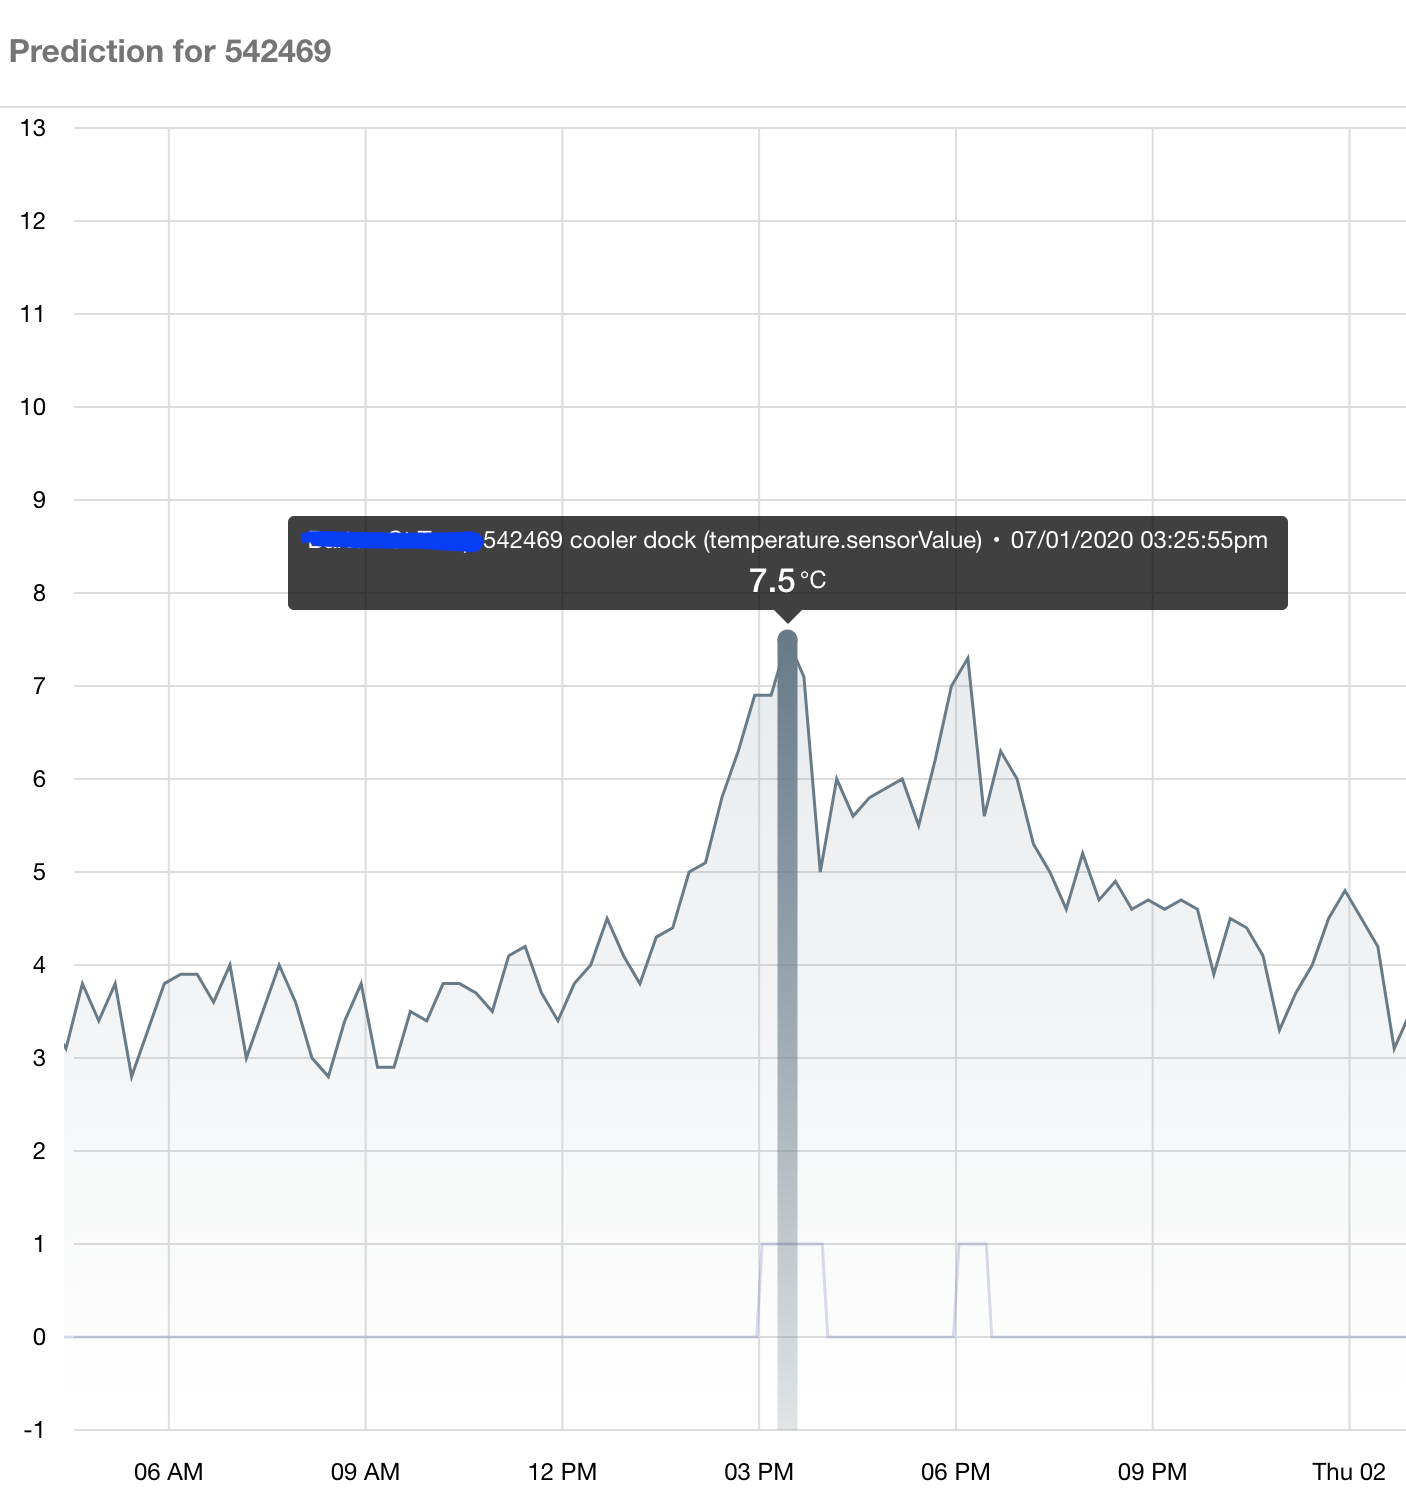
Diagram 3: Our predictive model detects a breach at 3:02 pm, approximately 23 minutes before the temperature actually exceed the threshold.
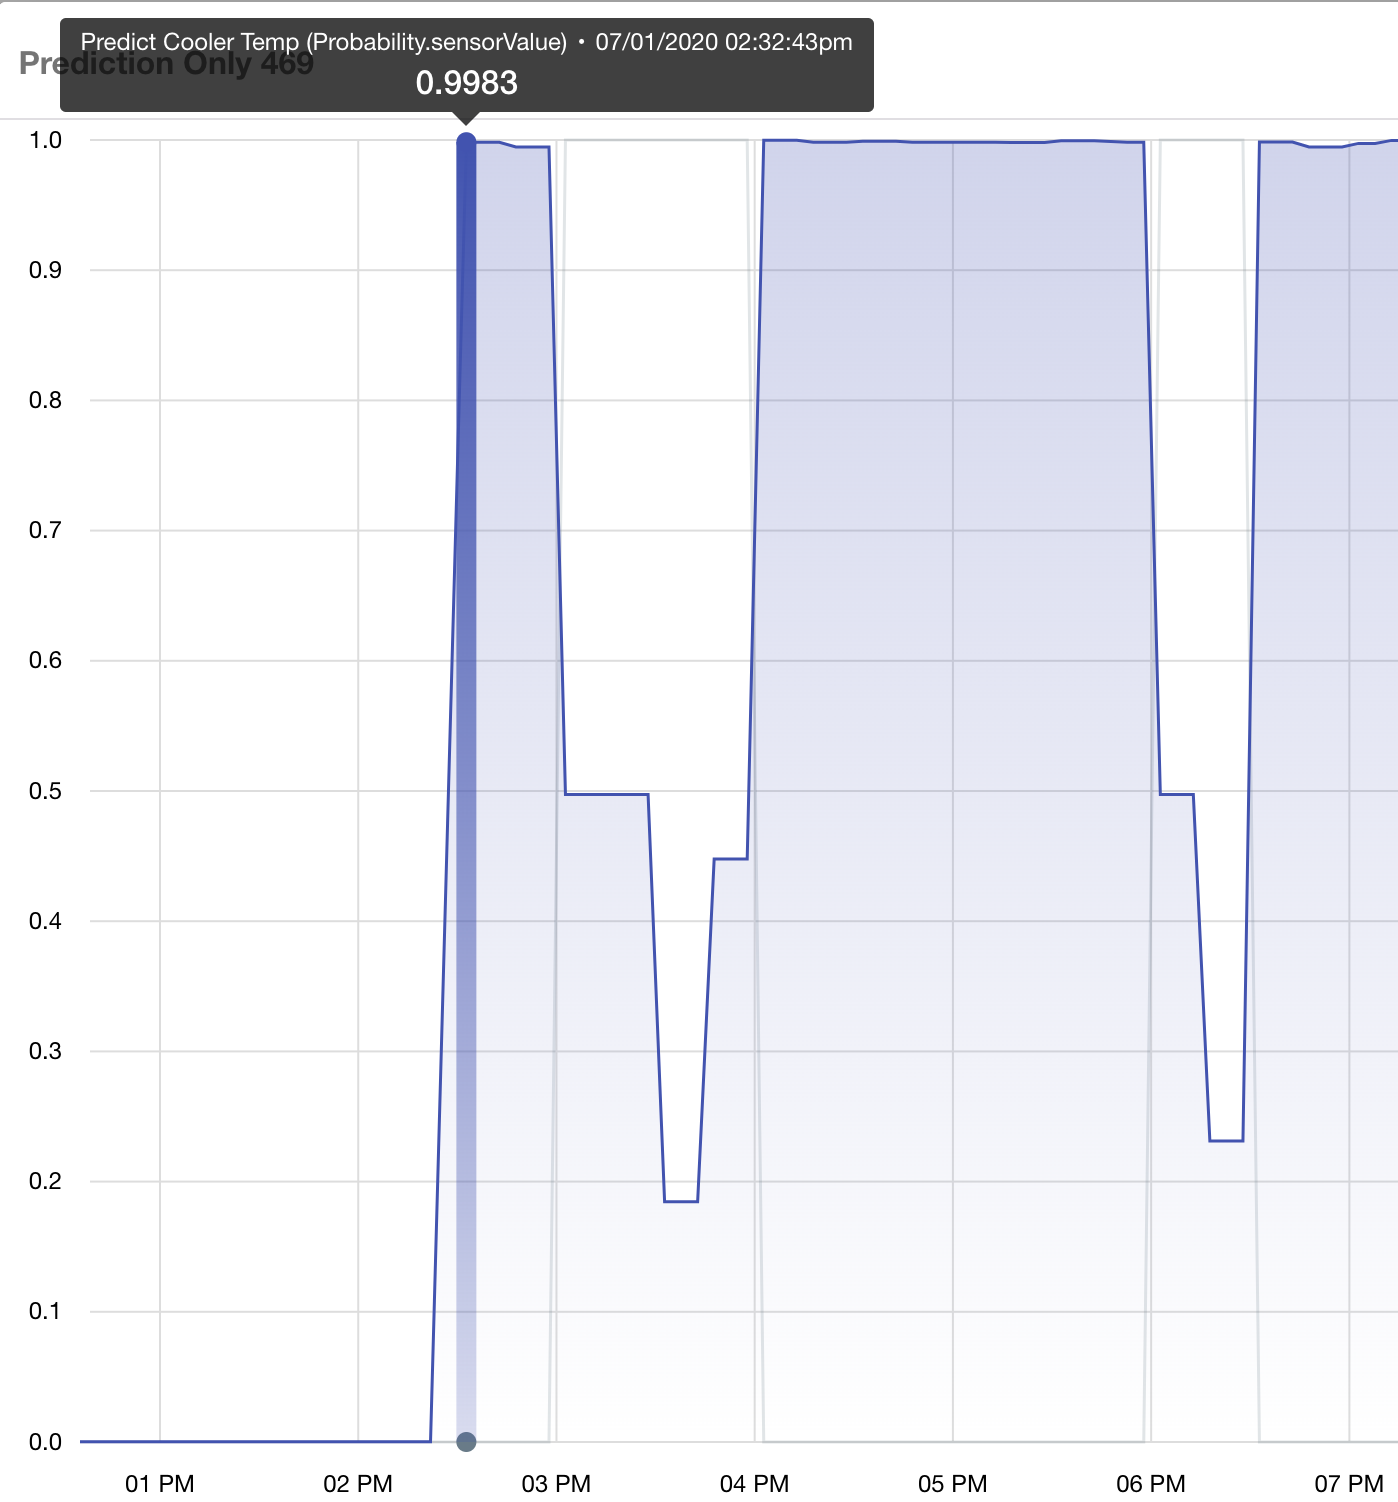
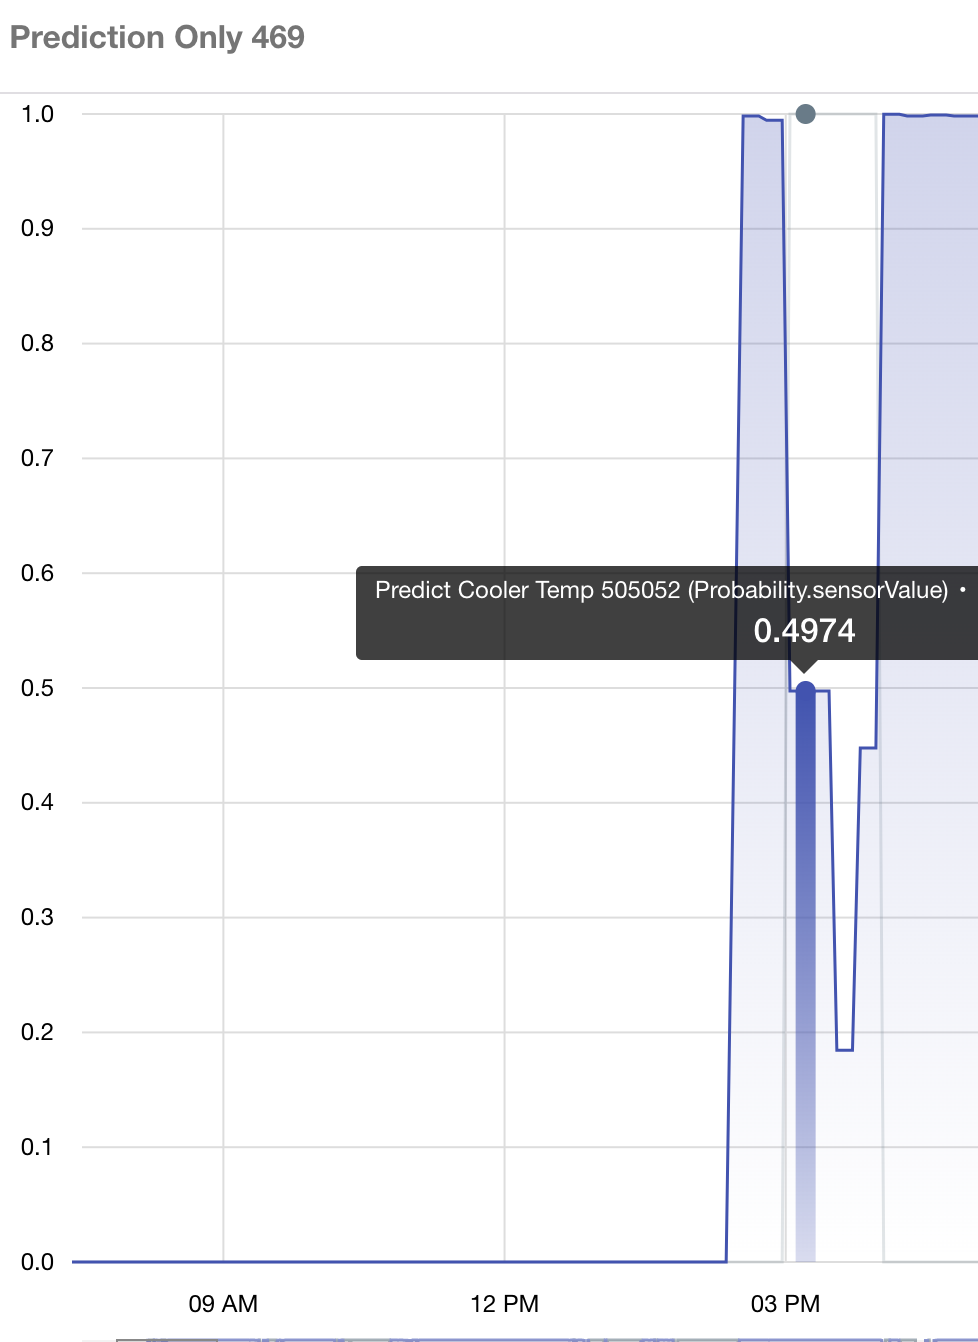
Diagram 4: A closer look at probability: The pending breach shows 49.7% probability, then declines as the temperature begins to drop/recover.